Monthly Household Spending Intentions – December 2021
Each month, analysis by CBA’s Global Economic and Markets Research team provides an early indication of spending trends across seven key household sectors in Australia. In addition to home buying, the series covers around 55 per cent of Australia’s total consumer spend across; retail, travel, education, entertainment, motor vehicles, and health and fitness.
Home Buying Intentions
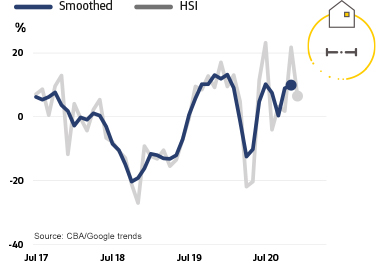
- After jumping higher in November, Home Buying spending intentions pulled back a little in the last month of 2020, but with the trend flat on the month.
- Home loan applications in December 2020 were lower than November, but higher than December the previous year. Google searches related to Home Buying were lower in December.
- We continue to expect the Home Buying market to be a key source of growth for the Australian economy in 2021 – driven largely by the very low level of interest rates.
Retail Spending Intentions
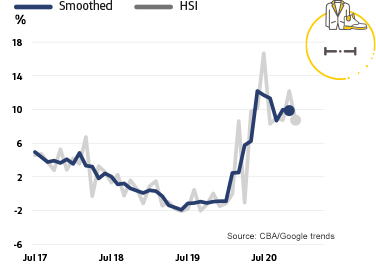
- Following a strong rise in November, Retail spending intentions were a little lower in December 2020, with the trend flat on the month.
- December saw improvements in the pace of spending on food & non-alcoholic beverages, medical and personal care and recreation.
- December saw strong increases on an annual rate for spending on clothing including uniforms, bakeries, grocery stores & supermarkets, convenience stores, department stores, discount stores, curtain, floor covering and furniture stores, paint, hardware and household appliance stores, digital apps, electronic stores, hobby-toy-game stores and pet shops.
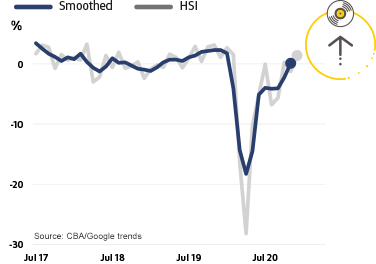
Travel Spending Intentions
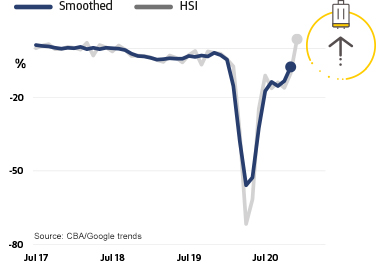
- Travel spending intentions jumped solidly in December 2020 as state border restrictions were largely lifted. While some restrictions were reimposed in late 2020/early 2021, this is a positive development. For the month of December, both actual spending and Google searches for travel increased.
- For December the biggest annual increases in spending were seen in camper, recreational & utility trailer dealers, motor home & recreational vehicle rentals and trailer parks & camp grounds. Not surprisingly, weakness is still evident in spending on airlines, cruise ships, timeshares, travel agencies and bus lines.
Health and Fitness Spending Intentions
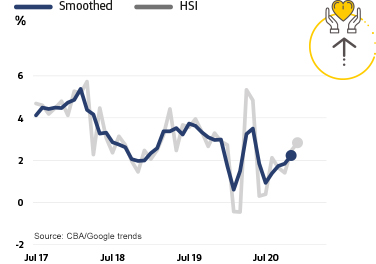
- Health and fitness spending intentions rose in December 2020, with actual spending activity stronger on the month even as Google searches declined.
- Spending activity in the health space was up in December 2020 vs the previous year in chiropractors, dentists, doctors, ambulance service, hospitals, medical and health services, nursing & personal care, osteopaths and podiatrists. Spending in the fitness space was up for sporting apparel, bicycle shops, sports clubs, golf clubs and sporting goods stores.
- The main area of weakness remains spending on commercial & professional sporting activities.
Entertainment Spending Intentions
- Entertainment spending intentions rose in December 2020, driven higher by both actual spending and Google search activity.
- Solid increases in spending in December 2020 (relative to December 2019) were seen in on-premises drinking places, off-premise alcohol stores, eating out/restaurants, fast food restaurants, art dealers & galleries, boat rentals, bowling alleys, pay TV, digital books, movies, music & games and music stores.
- Some weakness is still evident in spending on dance halls, studios & schools, movie theatres and live performance theatres.
Education Spending Intentions
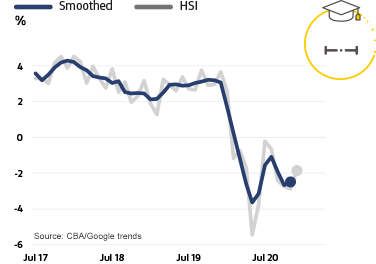
- Education spending intentions were essentially flat in December 2020, with an increase in the number of education related transactions offset by a decline in Google search activity relative to the same month in 2019.
- In terms of transaction volumes, December 2020 saw annual increases in spending on business & secretarial schools, correspondence schools, elementary & secondary schools, and trade & vocational schools. The number of transactions for universities and colleges was down significantly.
- In terms of the value of education transactions, weakness was seen in December 2020 in spending on universities & colleges and elementary & secondary schools..
Motor Vehicle Spending Intentions
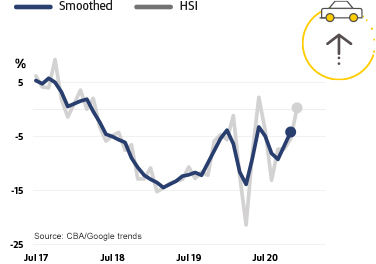
- Motor vehicle spending intentions rose further in December 2020, ending the year with solid momentum. Relative to the end of 2019, December 2020 saw strong increases in actual spending on new and used motor vehicles and an increase in loan applications to purchase a motor vehicle. This was partly offset by a small decline in Google searches.
- The ongoing improvement in the housing sector should help the outlook for the motor vehicle sector. RBA research has shown that spending on motor vehicles generally has the highest response to changes in property prices. Working against this trend is the increasing shift to work-from-home.
Notes for Editors:
About our monthly Household Spending Intentions series
The HSI series offers a forward-looking view by analysing actual customer behaviour from CBA’s transactions data, along with household search activity from Google Trends.
The approach focuses on Australian households and their spending intentions. Near real-time spending readings from CBA’s household transactions data was combined with relevant search information from Google Trends to map the data results on consumer spending. Households are the dominant part of the economy and drive much of its activity and volatility, and this combination adds to insights on prospective household spending trends in the Australian economy.
Google Trends is a publically available service that enables people to explore search trends around the world. These searches provide insights into what consumers are doing/researching on the Internet and what their spending intentions are.
CBA’s Household Spending Intentions series is published on the third Tuesday of every month. To find out more about the series, visit www.commbank.com.au/spendingintentions.
Disclaimer
The information contained in this media release is published solely for informational purposes and provides general market-related information, and is not intended to be an investment research report. This media release has been prepared without taking into account your objectives, financial situation (including the capacity to bear loss), knowledge, experience or needs. Before acting on the information in this media release, you should consider its appropriateness and, if necessary, seek appropriate professional or financial advice, including tax and legal advice. The data used in this media release is a combination of ‘CBA transaction data’ and Google Trends™ data. Google Trends is a trademark of Google LLC. The term ‘CBA transaction data’ refers to the proprietary data of the Commonwealth Bank of Australia ("the Bank") that is sourced from the Bank’s internal systems and may include, but is not limited to, credit card transaction data, merchant facility transaction data and applications for credit. The Bank takes reasonable steps to ensure that its proprietary data is accurate and that any opinions, conclusions or recommendations are reasonably held, or are made at the time of compilation of this media release. As the statistics take into account only the Bank’s data, no representation or warranty is made as to the completeness of the data and it may not reflect all trends in the market. All customer data used or represented in this media release is anonymous and aggregated before analysis, and is used and disclosed in accordance with the Bank’s Privacy Policy Statement.
Commonwealth Bank of Australia ABN 48 123 123 124 AFSL 234945.
Full disclosures and disclaimers.